Anechoic Response of a Loudspeaker Without an Anechoic Chamber: Splice Sequence
A test sequence that uses a near field and time-windowed far field measurement “spliced” together to measure a loudspeaker’s anechoic response in a normal room
This sequence measures the anechoic response of a loudspeaker in an ordinary room using both a near field and time-windowed far field measurement “spliced” together to cover the full bandwidth of the loudspeaker’s response from 20 Hz to 40 kHz. This sequence package contains a master sequence and three sub-sequences that cover the individual measurements that make up the complete test.
First, the microphone is placed very close to the low frequency driver (less than an inch from the woofer), and the near field frequency response measured using a 1/12th octave stepped sine). Next, the microphone is placed in the far field and the frequency response is measured using a continuous log sweep with the Time Selective Response analysis algorithm. An option is available for measuring a ported loudspeaker.
The near field measurement is unaffected by room reflections, but does not represent the free field response at high frequencies. The far field, time-windowed measurement is not affected by room reflections, but at low frequencies the room size limits the width of the time window and corresponding frequency resolution.
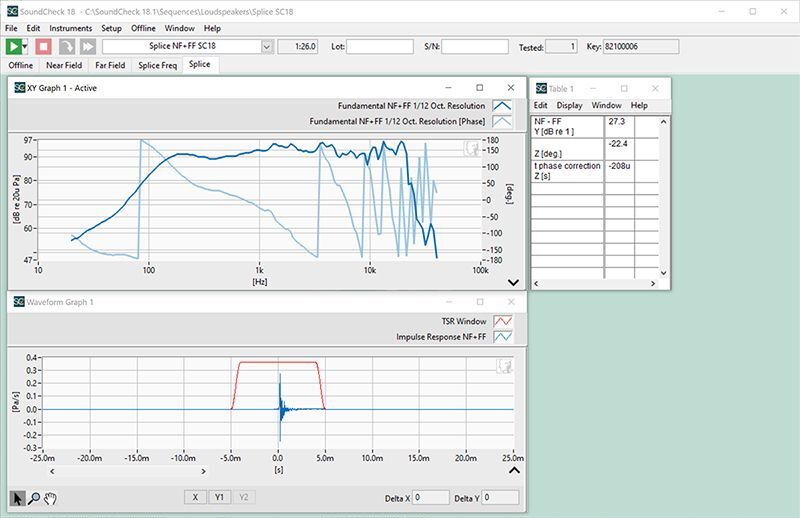
The sequence displays both measurements on a graph, showing the overlap range where the measurements are equal. From this, the user selects the precise frequency at which to splice the two halves of the measurements together to obtain the full range free field response of the loudspeaker. This is done in several post-processing steps including the inverse FFT of the final frequency response back to the time domain to calculate the impulse response. Differences in amplitude or phase are automatically corrected, and this information is displayed in the table on the final display step.
The sequence can be run with stored data as well and experimentation with the time window can be performed without having to re-measure data. The curve data and time waveforms (e.g. impulse response) can be analyzed in SoundMap, SoundCheck’s time-frequency analysis module, or exported for further analysis.
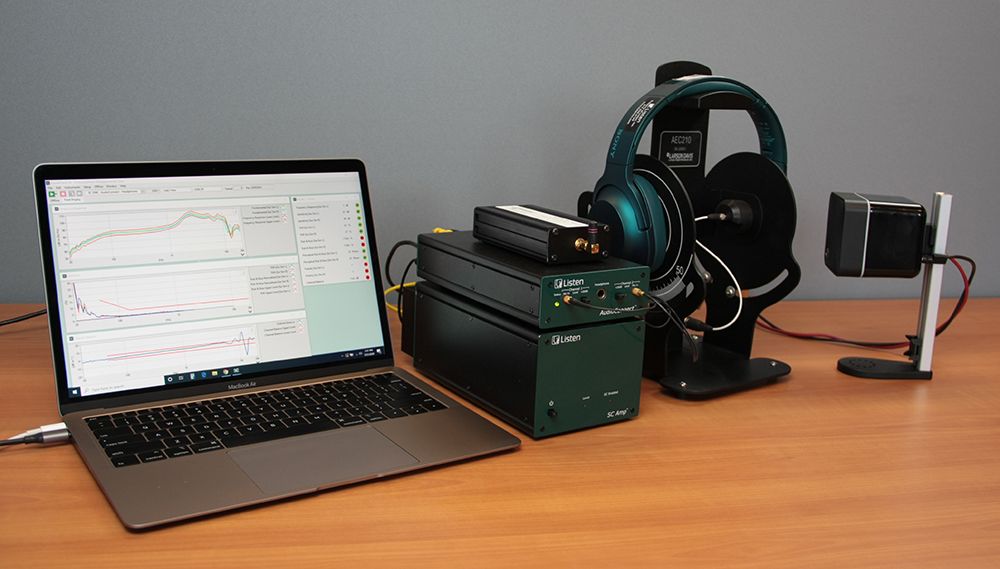
Required Equipment
Hardware
- Reference Microphone – Listen SCM-3 PN 4004 or similar
- Audio Interface/Microphone Power Supply – Listen AudioConnect PN 4050 or similar
- Audio Power Amplifier – Listen SCAmp PN 4060 or similar
Software
- SoundCheck Plus, version 18.0 or later
- Module PN 2006 – Time Selective Response

your
local specialist
for